
Business data & decisions
Your business data should not wait for the next management meeting
Connect finance, sales and operations in a shared data foundation so your teams can investigate changes and act before the next reporting meeting.
By DataTalks · · 4 min read
A customer order is confirmed. A supplier invoice arrives. A team records the hours spent on a project.
Your existing systems capture these events every day. How long does it take for that information to reach the people making decisions?
In a growing business, the answer often involves exports, spreadsheets, emails and reporting meetings. By the time the figures reach the leadership team, another week of purchasing, capacity and cash-flow decisions may already have passed.
Shortening that journey is not just a reporting improvement. It is a way to build a business platform around how your teams actually work.
The distance between operations and decisions
In their essay From Hierarchy to Intelligence, published by Sequoia Capital on March 31, 2026, Jack Dorsey and Roelof Botha describe hierarchy as a mechanism for routing information. Managers gather context, consolidate it and pass it through the organisation. They argue that AI can increasingly perform some of this coordination, supported by a continuously updated picture of the business.
For business leaders, this raises a practical question: how much of your reporting process exists simply to move information from one place to another?
Imagine a finance manager collecting figures from several business units. Sales come from a CRM, costs from an ERP and delivery progress from operational spreadsheets. Someone reconciles customer names, checks totals and prepares a summary for the weekly meeting.
Every handover requires effort and can introduce delays or inconsistencies. Much of the underlying information already exists. The challenge is turning separate records into a reliable view that people can use without rebuilding it each week.
Further reading: From Hierarchy to Intelligence — Jack Dorsey and Roelof Botha, Sequoia Capital, March 31, 2026
Give everyone access to the same operational picture
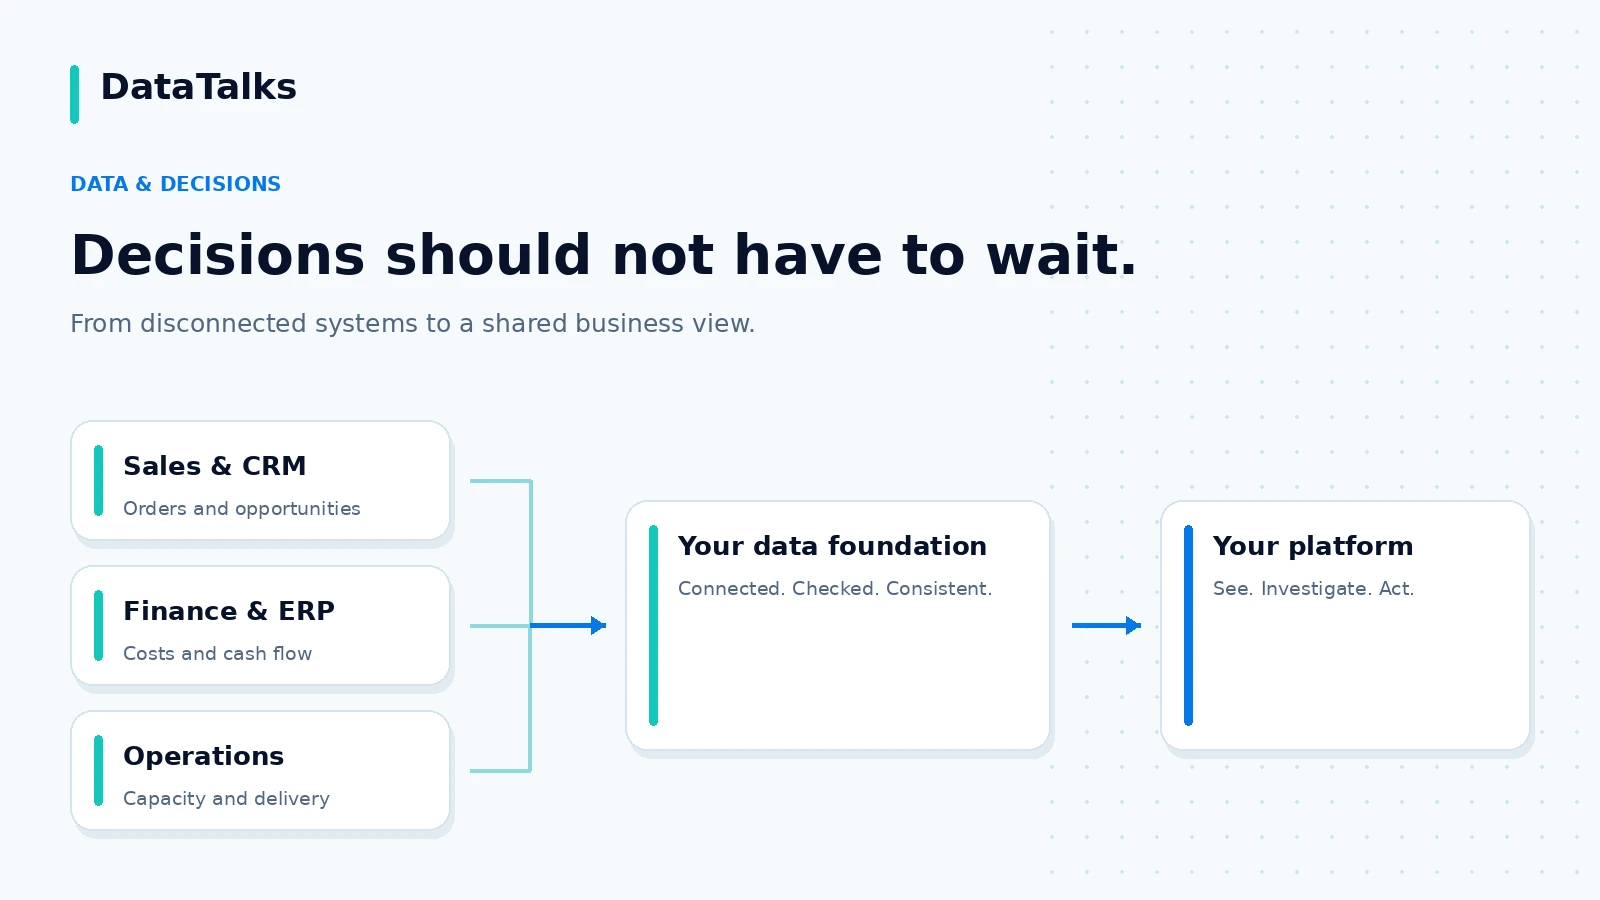
A more direct approach starts by connecting your ERP, CRM, finance tools and operational applications to a shared data foundation. You do not have to replace every system to make their information work together.
Data pipelines collect, check and organise records using consistent business definitions. Leadership can review overall performance, while finance, sales and operations teams see the information relevant to their responsibilities and access rights.
Consider an illustrative service business whose revenue is growing while delivery costs rise faster. A sales report alone suggests a successful month. Connecting invoices, project assignments and actual hours reveals which types of work need a closer look.
The delivery manager can then add context: onboarding a new team, covering an absence or handling a change in scope. The figures establish what changed; the conversation helps explain why and determine what to do next.
Direct access requires consistent definitions
Connecting systems is only part of the work. Does revenue mean orders booked, invoices issued or revenue recognised? Are amounts net of VAT? Do delivery costs include subcontractors? Are business units reporting in the same currency and period?
Without common definitions, a polished dashboard can still compare incompatible figures. Faster access to those figures does not make the comparison more useful.
A reliable foundation needs agreed calculations, mappings between systems and checks for missing or delayed records. Users should know when information was refreshed and be able to trace a result back to its source. Provisional operational figures should be distinguishable from closed accounting periods.
That is where data engineering and business understanding meet: a number that people across the organisation can understand, verify and use with confidence.
AI builds on the same foundation
With structured data and defined measures in place, teams can explore questions in everyday language. Useful starting points include:
An AI assistant can use governed analytical tools to investigate these questions and explain the results. It should respect the same access rules as your reporting, identify the sources behind its answer and make missing information visible rather than fill gaps with plausible explanations.
The shared foundation supports both dashboards and AI. It can also power custom workflows: for example, an approved purchase can feed a cash forecast, with a link back to the approval that changed it. Analysis becomes more useful when it connects to the work people need to do next.
- Which business units saw delivery costs grow faster than revenue?
- Which overdue invoices explain the change in our expected cash position?
- Where is demand increasing without a corresponding change in available capacity?
Bring decisions closer to the source
As a business grows, more entities, tools and handovers can lengthen the path from an operational event to a management decision. A shared data infrastructure helps keep that path short, with refresh schedules matched to the decisions that matter rather than a promise that everything must be real time.
Start with one recurring bottleneck: a report that takes days to assemble, a reconciliation nobody trusts or a decision repeatedly made with outdated information. Agree the definitions, connect the relevant sources and make the result available to the people responsible for acting on it.
At DataTalks, we connect existing systems and build custom business platforms around reporting, workflows and AI. The aim is not another dashboard in isolation, but a dependable connection between your data and your daily operations.
Your business generates the information every day. Make it available while there is still time to act on it.